
Check what the chart is counting
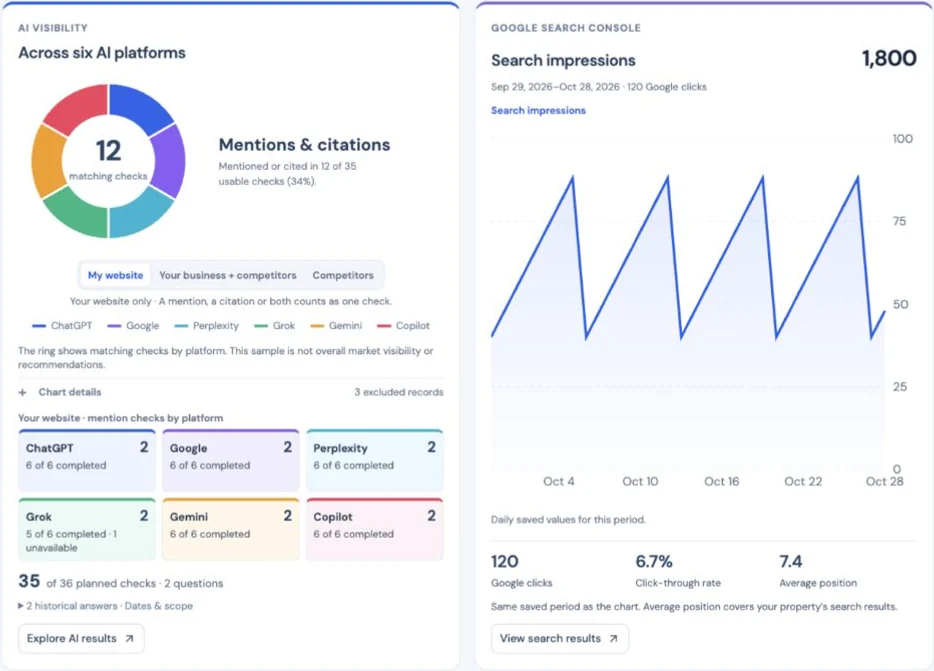
Overview puts AI Visibility, Google Search Console, Keyword Tracking and Signal Analytics summaries together when their data is available. The detailed sections keep the original answers, page records and dates accessible. An unavailable connection is shown as unavailable rather than filled with example measurements.
Choose the website in the main dropdown.
The dashboard sections follow that website. Free accounts open Website Readiness; full reports and subscribers can open Overview for a summary.
Read the source, dates and unit.
A saved rank, a Search Console average position and estimated search demand measure different things. A total for the period is not a daily value.
Check filters before comparing totals.
Your website, saved competitors, AI platforms, ranking sources and date ranges can select different samples. Open the rows or answers behind a chart before acting.
 Open larger image ↗
Read the AI Visibility donut
For a particular store or branch, the visible Whole brand and This location buttons separate company-wide appearances from evidence of the selected location. Whole brand preserves the original brand counts, including corporate citations. This location requires a selected-store link or verified branch wording, store number, address or phone in the business passage. A city or corporate link alone does not identify a store. Both views use the same saved questions; the evidence cards explain the distinction.
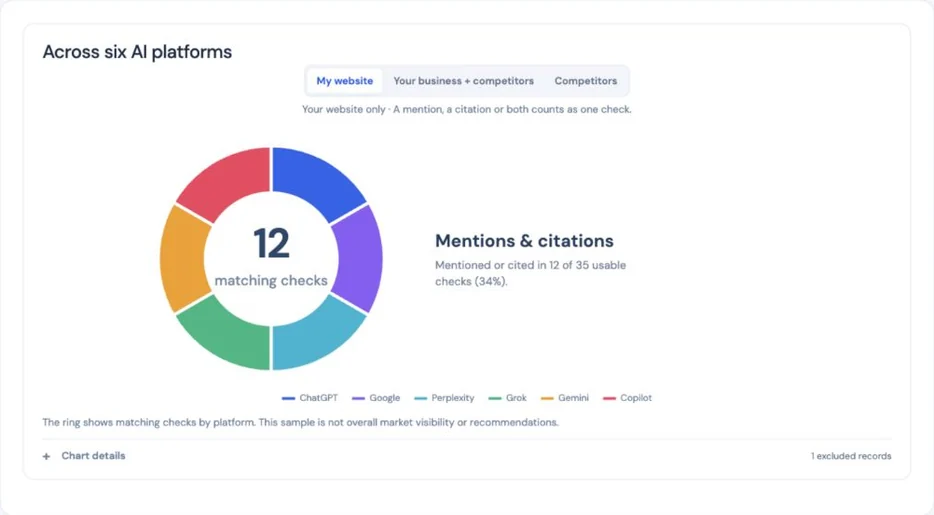
My website is the default in both Overview and AI Visibility. The enlarged Overview donut keeps its filters below the chart; the full AI Visibility page places them above it. Choose Your business + competitors or Competitors when you want a wider comparison. Colors identify the six platforms.
Mentions & citations counts each usable discovery check once when it names an included business, links to its website, or does both. Several links or several included businesses in one answer still count once. The center shows matching checks; the nearby sentence gives the usable total and percentage. Mention and citation counts remain separately available in the evidence because they can overlap. The platform tiles describe your own website, even when the ring includes competitors.
Only matching checks appear in the ring. A usable sample with zero matches stays zero; no usable checks means Not assessed. Failed, unavailable, garbled and invalid-question checks do not enter the usable total. Historical research, named-business questions and secondary-offering checks stay separate. Open Chart details for exclusions, and read the saved answers before acting. This sample is not overall market visibility, market share or a count of recommendations.
 Open larger image ↗
Use the setup tiles when a connection is missing
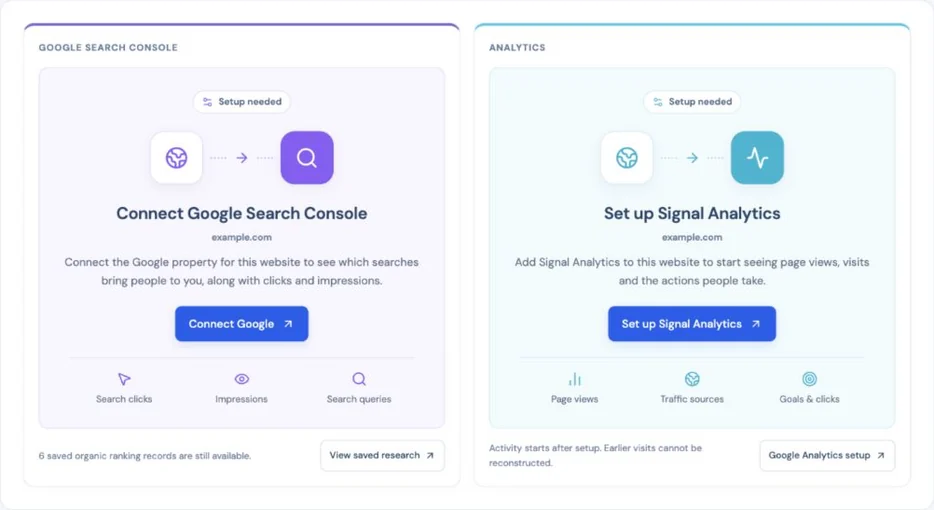
Overview shows a setup tile instead of an empty chart when Google Search Console or Signal Analytics has no matching saved data. Choose the website in the main dropdown first. Connect Google opens Search Console setup; Set up Signal Analytics opens tracking setup for that website. Connecting one website does not configure every website in your account.
If Google is already connected, Finish Google setup means a matching property still needs attention. Reconnect Google asks you to restore access. A connection error or a loading state does not mean zero traffic. Once matching measured data is available, the card shows the chart; measured zeroes remain zeroes.
These connections require a monthly plan. A full one-time report keeps its saved research but does not include ongoing analytics. Use View monthly plans or View analytics plans when shown. Google Analytics has its own tab under Analytics; link the matching GA4 property there. Signal Analytics records activity after installation and cannot reconstruct earlier visits.
 Open larger image ↗
Read keyword demand and local ranking evidence
When the original keyword response includes them, Demand history & CPC shows up to twelve saved monthly Google search estimates and an estimated advertising cost per click in USD. These use the keyword’s country and language. CPC is not organic difficulty, your report cost or a traffic forecast. Older raw receipts can supply these fields without buying another lookup; absent fields stay unknown.
To track a city or service area, select a saved keyword, open its details and choose Find my supported locations. Your website setup must name a local or regional service area. Pick a verified location, language and device before saving. Each combination uses a tracking slot. Existing country histories remain separate.
A city search can retain Google local-pack evidence from the same scheduled organic search response. A website match is required; a similar name alone is insufficient. No returned local pack or a listing without a matching website is not a zero or proof the business is absent from Maps. These are local-pack observations, not a dedicated Google Maps grid.
Use keyword bars and movement charts
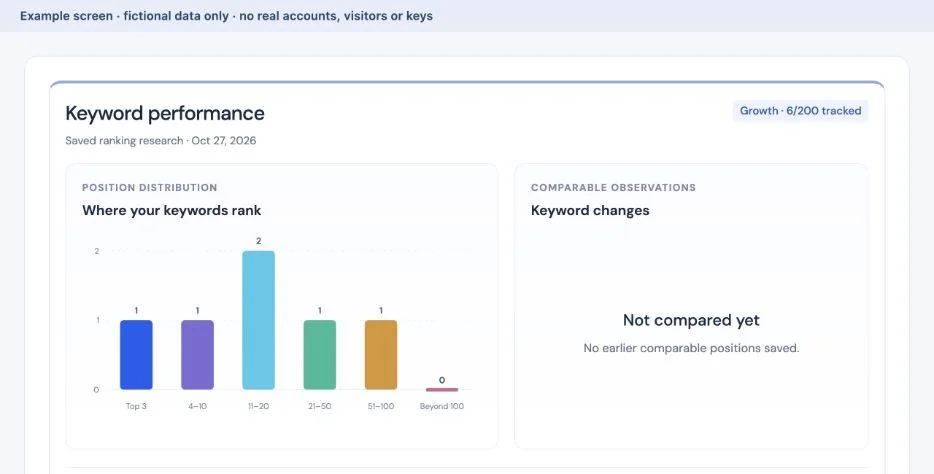
Where your keywords rank groups the available measured positions into rank ranges. Bar height counts keywords, not visits or monthly searches. A small colored baseline marker labeled 0 still means zero keywords in that range. A dash or Not assessed means a measurement was not saved.
Choose Ranking data when several sources are available. Keyword changes compares only positions with a suitable earlier observation in the same measurement series. Improved, Unchanged and Declined cover those comparable keywords; the denominator may be smaller than the full keyword list. If there is no comparable history, the chart says Not compared yet.
A scheduled ranking line puts position one at the top. Failed, missing and outside-range checks leave gaps. Search Console average positions cover a period and should not be joined to one-time search observations as one trend.
 Open larger image ↗
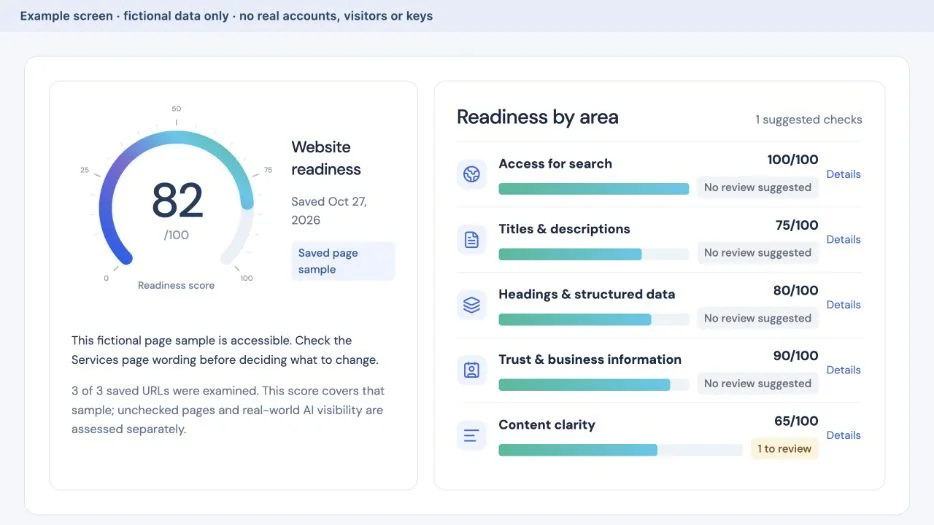
Read the readiness gauge and area bars
The gauge shows the saved website-readiness score out of 100. It is a score for examined pages, not a traffic trend, a count of AI recommendations or a promise about rankings. The area bars separate access, titles and descriptions, structure, business information and content clarity.
Open Details beside an area to review its saved checks and pages. Use Previous and Next to compare areas or matching saved pages; Back to review area restores its search, list page and reading position. Read the coverage and failed-request labels before deciding what to fix. Free accounts keep the gauge, area bars and findings together on Website Readiness, rather than repeating them on a second Overview page.
 Open larger image ↗
Compare websites and backlinks carefully
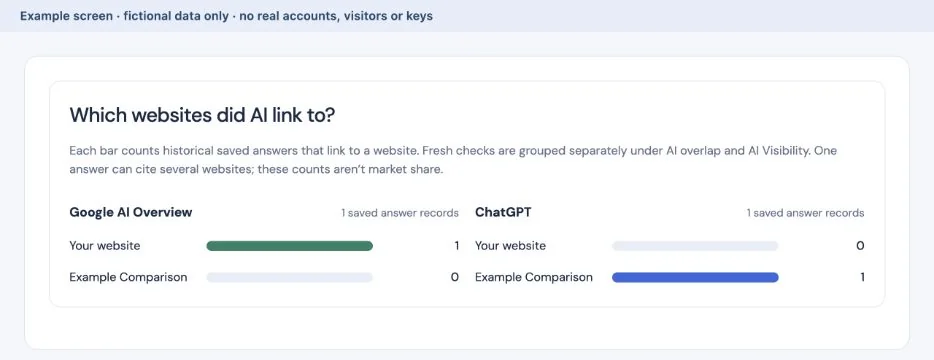
The Competitors citation bars count historical saved answers that link to each website. One answer can link to several websites, so these bars are not slices of an exclusive market. Fresh AI overlap is labeled separately. A nominated comparison site can also be a publisher or directory rather than a direct business rival.
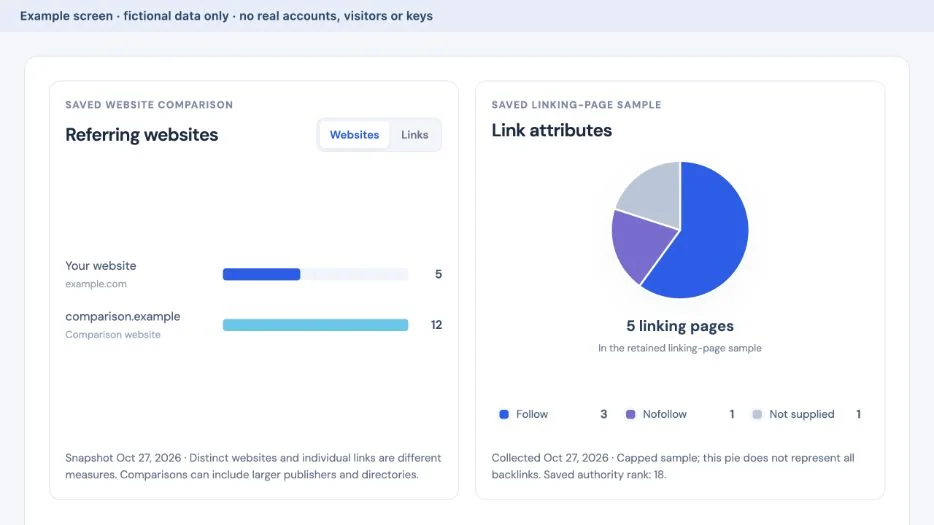
Backlinks has bars for distinct referring websites or individual incoming links. Use Websites or Links to choose the unit. Its Link attributes pie describes the retained linking-page sample, including unknown attributes. If the sample is capped, the pie does not represent every backlink. Source ideas are possible research leads, not confirmed incoming links.
 Open larger image ↗
 Open larger image ↗
Keep the three Analytics sources separate
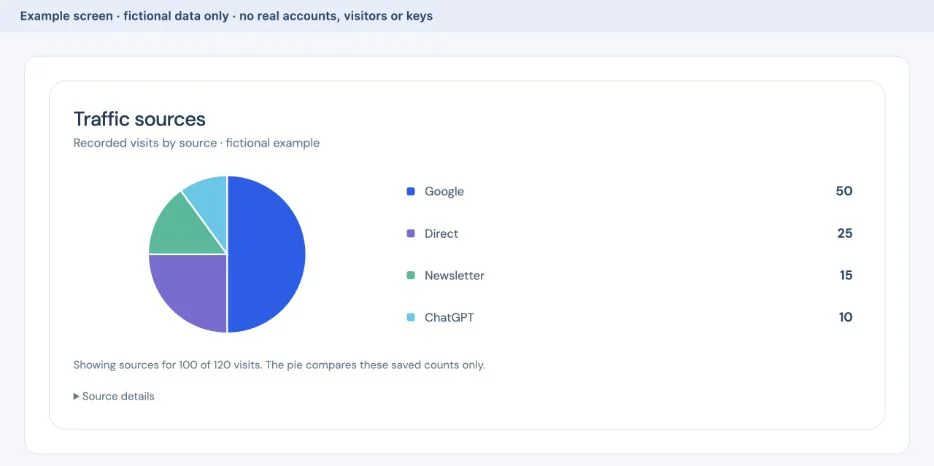
All three follow the main website selector. Open Analytics, then switch between Signal Analytics, Google Search Console and Google Analytics across the top. Drag those tabs to change their order. Their totals need not match because they collect different activity with different settings and coverage. Hover a chart or select its legend where offered to inspect a category. Check the written coverage beside it. Changing a chart filter does not purchase a website scan.
| View | Charts and numbers | Check before comparing |
|---|---|---|
| Signal Analytics | Recorded page views over time and a source pie for the available visit or earlier page-view sample. | Basic counts and permission-based detailed visits have different coverage. Direct can mean no referrer was available; it does not prove AI traffic. |
| Google Search Console | Search clicks and impressions over time, plus query and page rows. The dashboard Overview summarizes saved impressions. | Google clicks are not website visits. Read each axis and period; missing daily values leave gaps rather than becoming zero. |
| Google Analytics | Visits over time from the saved GA4 property report, alongside active users, page views, important actions and source tables. | Use the property linked to the selected website. Source rows can be partial, so their table may cover less than the period total. |
 Open larger image ↗
Use a zero or a gap to choose the next check
Zero means the selected measured sample recorded none. Collecting answers means results are still pending. Not collected, Not assessed, unavailable requests and a missing connection mean different things. A colored zero marker makes the chart easier to see; it does not add a positive result.
For AI Visibility, read the actual answers before deciding a page needs work. For rankings, check the source and comparable history. For traffic, check installation, permission, property and dates before concluding nobody visited. A change in a chart does not prove what caused it.
History & Exports downloads the selected saved snapshot, not every website or all saved reports. Connected analytics and later collections keep their own dates and export options. Interactive chart filters do not turn a saved-data download into a new scan or guarantee that its layout matches the PDF.
Useful links
Product documentation prepared with AI assistance and checked against the current application. If a step no longer matches your dashboard, let us know. Do not send passwords or connection keys.